Code
library(palmerpenguins)
library(ggplot2)
library(dplyr)
library(gt)Exploring penguin measurements across species and islands in Antarctica.
library(palmerpenguins)
library(ggplot2)
library(dplyr)
library(gt)The Palmer Penguins dataset contains measurements for 344 penguins from three species observed on three islands in the Palmer Archipelago, Antarctica.
Click a card to learn more about each species.
Click to flip
Islands: All three
Avg mass: 3,701 g
Avg flipper: 190 mm
Diet: Krill
Click to flip
Island: Dream
Avg mass: 3,733 g
Avg flipper: 196 mm
Diet: Krill
Click to flip
Island: Biscoe
Avg mass: 5,076 g
Avg flipper: 217 mm
Diet: Fish & krill
ggplot(penguins, aes(x = flipper_length_mm, y = body_mass_g, color = species, shape = species)) +
  geom_point(size = 2.5, alpha = 0.7) +
  scale_color_manual(values = c("darkorange", "purple", "cyan4")) +
  labs(
    x = "Flipper Length (mm)",
    y = "Body Mass (g)",
    color = "Species",
    shape = "Species"
  ) +
  theme_minimal()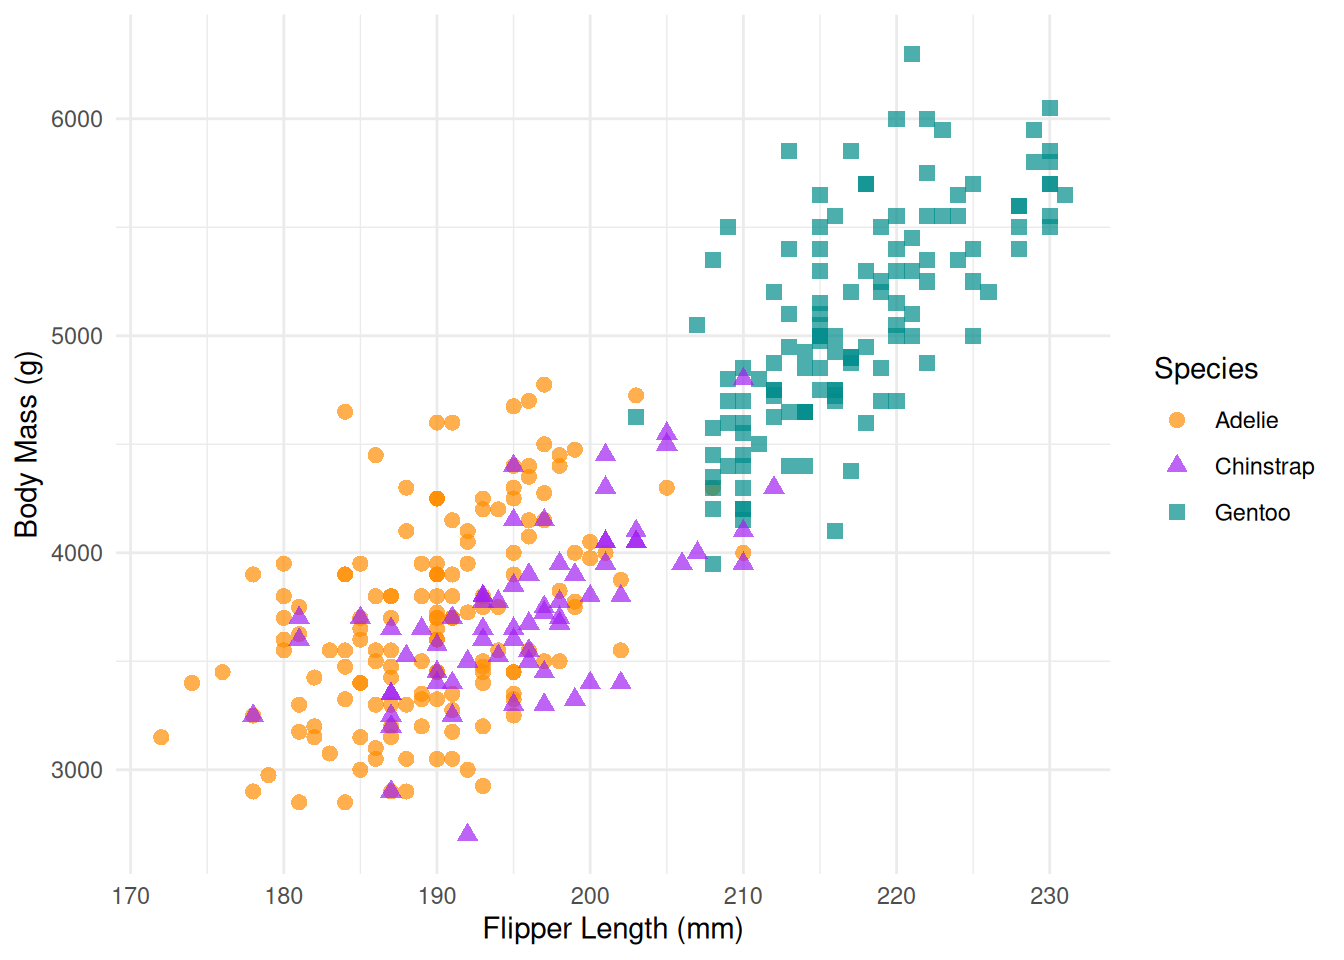
penguins |>
  filter(!is.na(body_mass_g)) |>
  group_by(species) |>
  summarise(
    Count = n(),
    `Mean Body Mass (g)` = round(mean(body_mass_g), 0),
    `Mean Flipper Length (mm)` = round(mean(flipper_length_mm, na.rm = TRUE), 1),
    `Mean Bill Length (mm)` = round(mean(bill_length_mm, na.rm = TRUE), 1),
    `Mean Bill Depth (mm)` = round(mean(bill_depth_mm, na.rm = TRUE), 1)
  ) |>
  gt() |>
  tab_header(
    title = "Penguin Species Summary",
    subtitle = "Averages across all islands"
  ) |>
  cols_label(species = "Species") |>
tab_source_note("Source: palmerpenguins R package")| Penguin Species Summary | |||||
| Averages across all islands | |||||
| Species | Count | Mean Body Mass (g) | Mean Flipper Length (mm) | Mean Bill Length (mm) | Mean Bill Depth (mm) |
|---|---|---|---|---|---|
| Adelie | 151 | 3701 | 190.0 | 38.8 | 18.3 |
| Chinstrap | 68 | 3733 | 195.8 | 48.8 | 18.4 |
| Gentoo | 123 | 5076 | 217.2 | 47.5 | 15.0 |
| Source: palmerpenguins R package | |||||
Swipe or use the arrows to browse penguin fun facts.
penguins |>
  filter(island == "Biscoe") |>
  ggplot(aes(x = species, y = body_mass_g, fill = species)) +
  geom_boxplot(alpha = 0.7, show.legend = FALSE) +
  scale_fill_manual(values = c("darkorange", "cyan4")) +
  labs(x = NULL, y = "Body Mass (g)") +
  theme_minimal()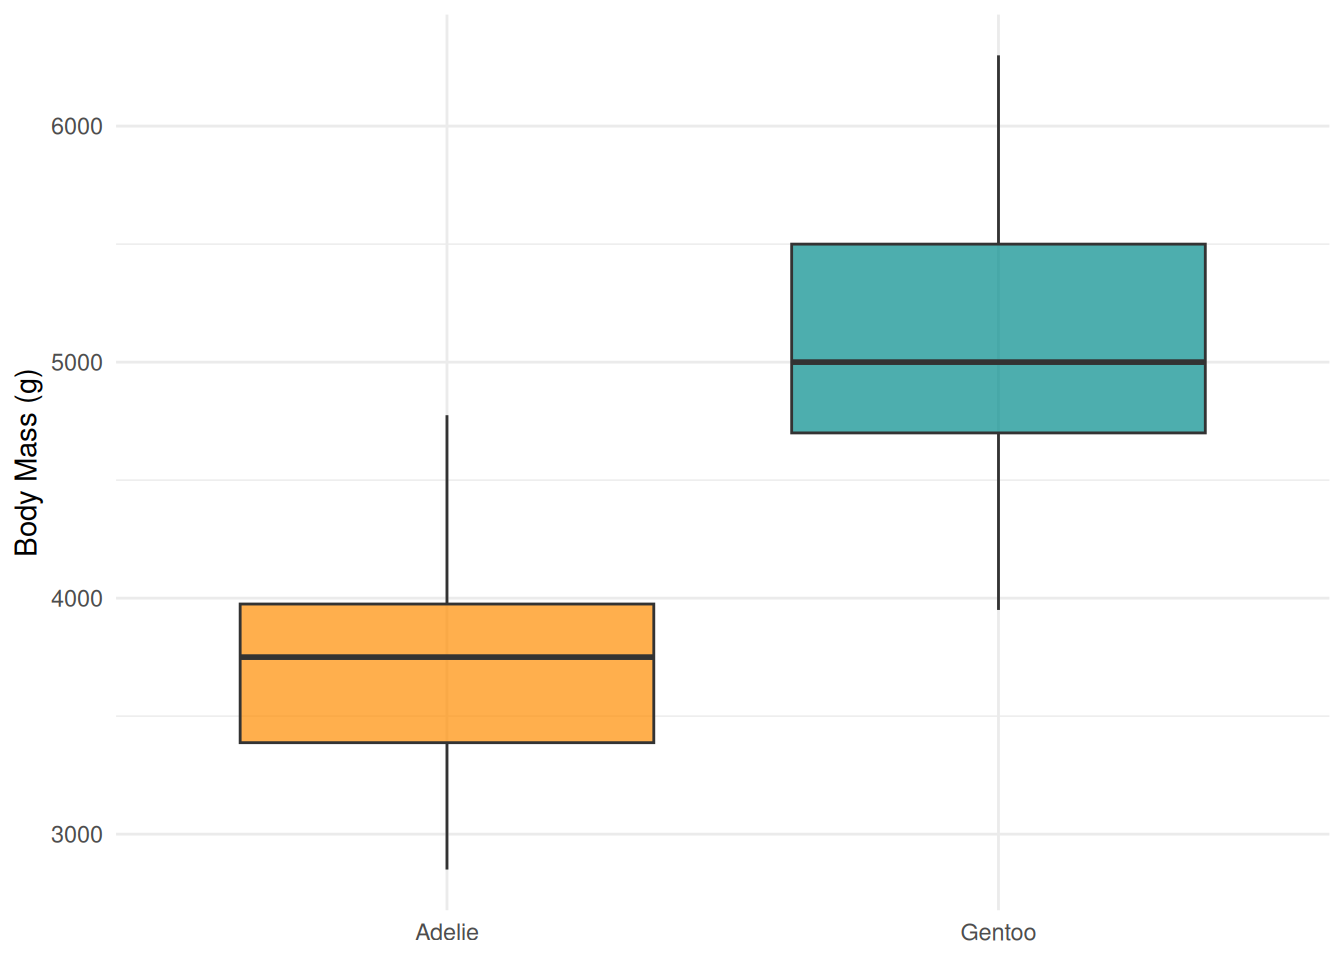
penguins |>
  filter(island == "Dream") |>
  ggplot(aes(x = species, y = body_mass_g, fill = species)) +
  geom_boxplot(alpha = 0.7, show.legend = FALSE) +
  scale_fill_manual(values = c("darkorange", "purple")) +
  labs(x = NULL, y = "Body Mass (g)") +
  theme_minimal()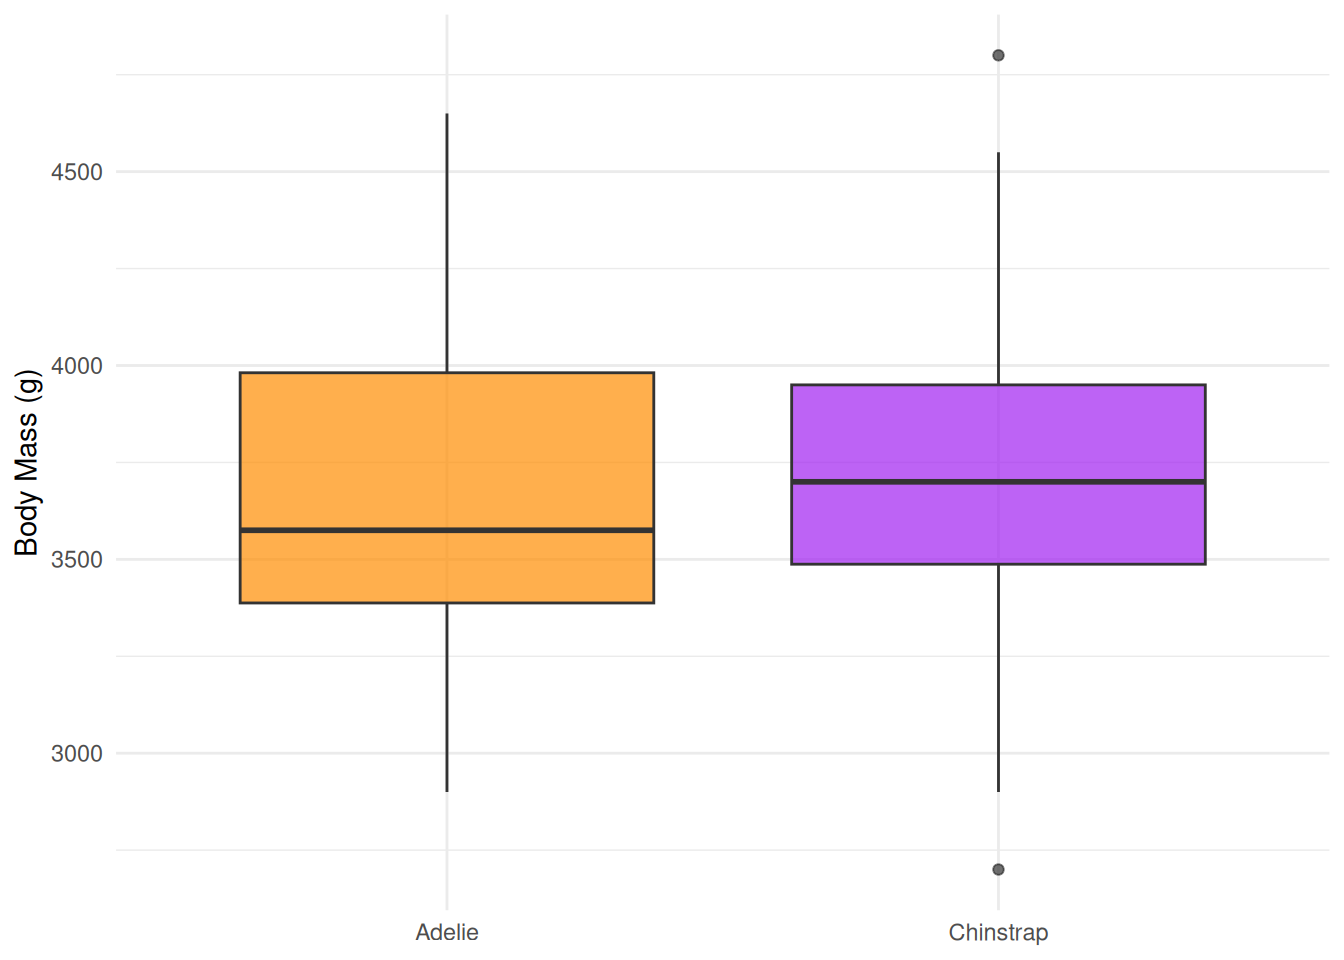
penguins |>
  filter(island == "Torgersen") |>
  ggplot(aes(x = species, y = body_mass_g, fill = species)) +
  geom_boxplot(alpha = 0.7, show.legend = FALSE) +
  scale_fill_manual(values = c("darkorange")) +
  labs(x = NULL, y = "Body Mass (g)") +
  theme_minimal()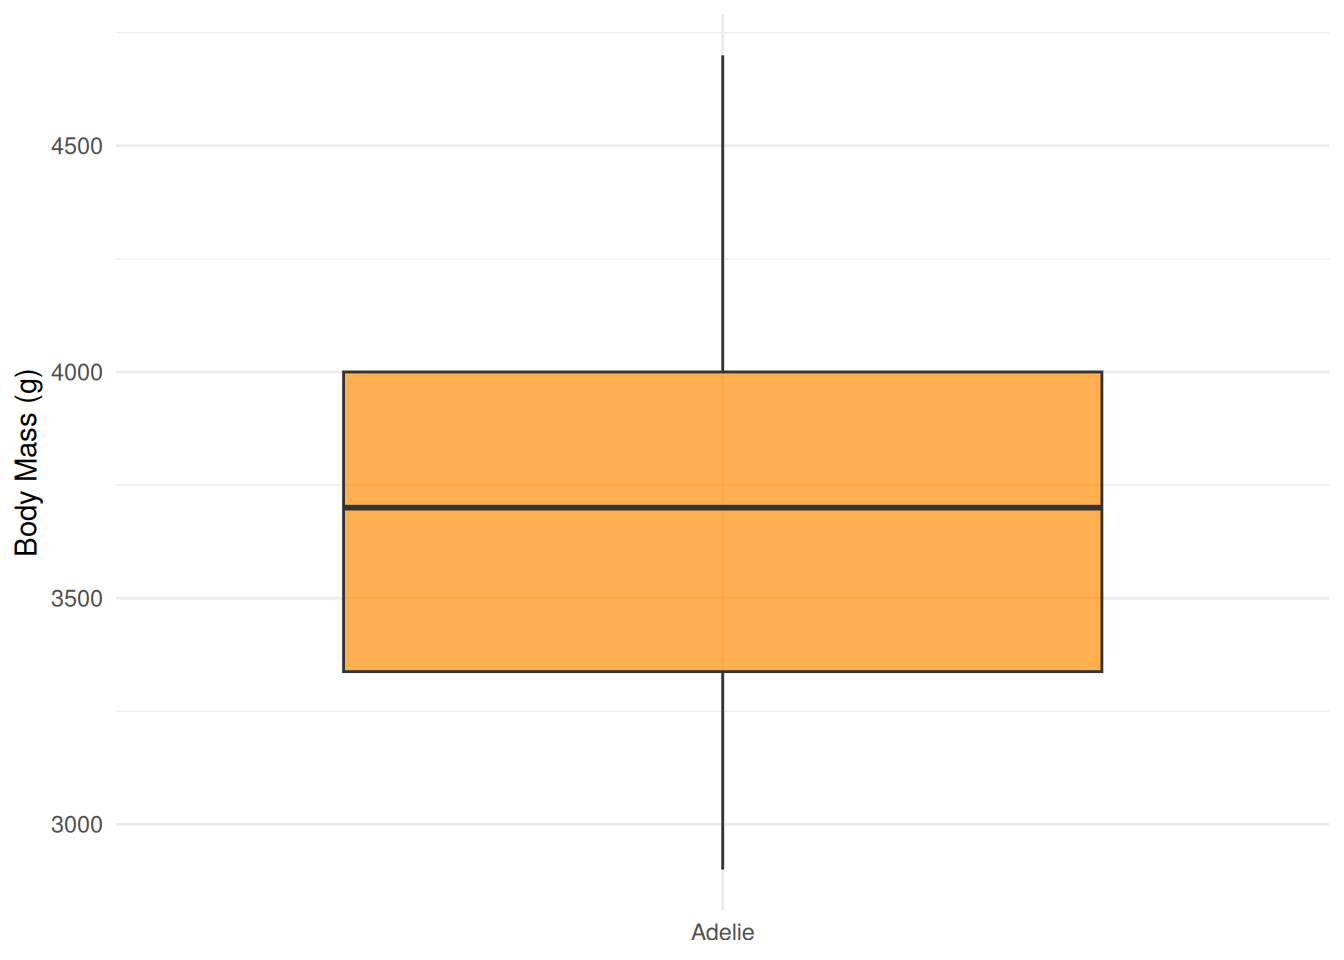
The Palmer Penguins dataset was collected by Dr. Kristen Gorman and the Palmer Station, Antarctica LTER, a member of the Long Term Ecological Research Network. The data were collected from 2007–2009 and include the following variables:
This dataset is commonly used as an alternative to the iris dataset for data exploration and visualization examples.
penguins |>
  summarise(across(everything(), ~ sum(is.na(.)))) |>
  gt() |>
tab_header(title = "Missing Values per Column")| Missing Values per Column | |||||||
| species | island | bill_length_mm | bill_depth_mm | flipper_length_mm | body_mass_g | sex | year |
|---|---|---|---|---|---|---|---|
| 0 | 0 | 2 | 2 | 2 | 2 | 11 | 0 |